Overview
This week shifted focus from conceptual framework to technical implementation. The challenge was finding the most efficient and intuitive tool for volumetric visualization while maintaining real-time audio reactivity and interactive capabilities.
The primary research question became: How can 1D audio data be translated into 3D visual density without losing intuitiveness? This required exploring various generative art tools and understanding their capabilities for point cloud systems.
Research & Development
Goal
To find the most efficient and intuitive tool for volumetric visualization that could support real-time audio analysis, particle systems, and interactive capabilities. The tool needed to balance technical capability with creative flexibility while maintaining performance for installation contexts.
Process
Explored various generative art tools including Processing, openFrameworks, Unity, and TouchDesigner. Conducted R&D on how to present sound stereoscopically rather than as a flat 2D graph, investigating point cloud rendering, particle dynamics, and audio-reactive systems.
Technical Challenges
Challenge
The primary technical challenge was translating 1D audio data (frequency spectrum and amplitude) into 3D visual density without losing intuitiveness. Traditional visualizations like waveforms and spectrograms are inherently two-dimensional. The question became: How can we spatialize sound in a way that feels natural and reveals hidden qualities?
Additionally, the tool needed to support real-time processing for interactive installations while maintaining visual quality and responsiveness.
Solution
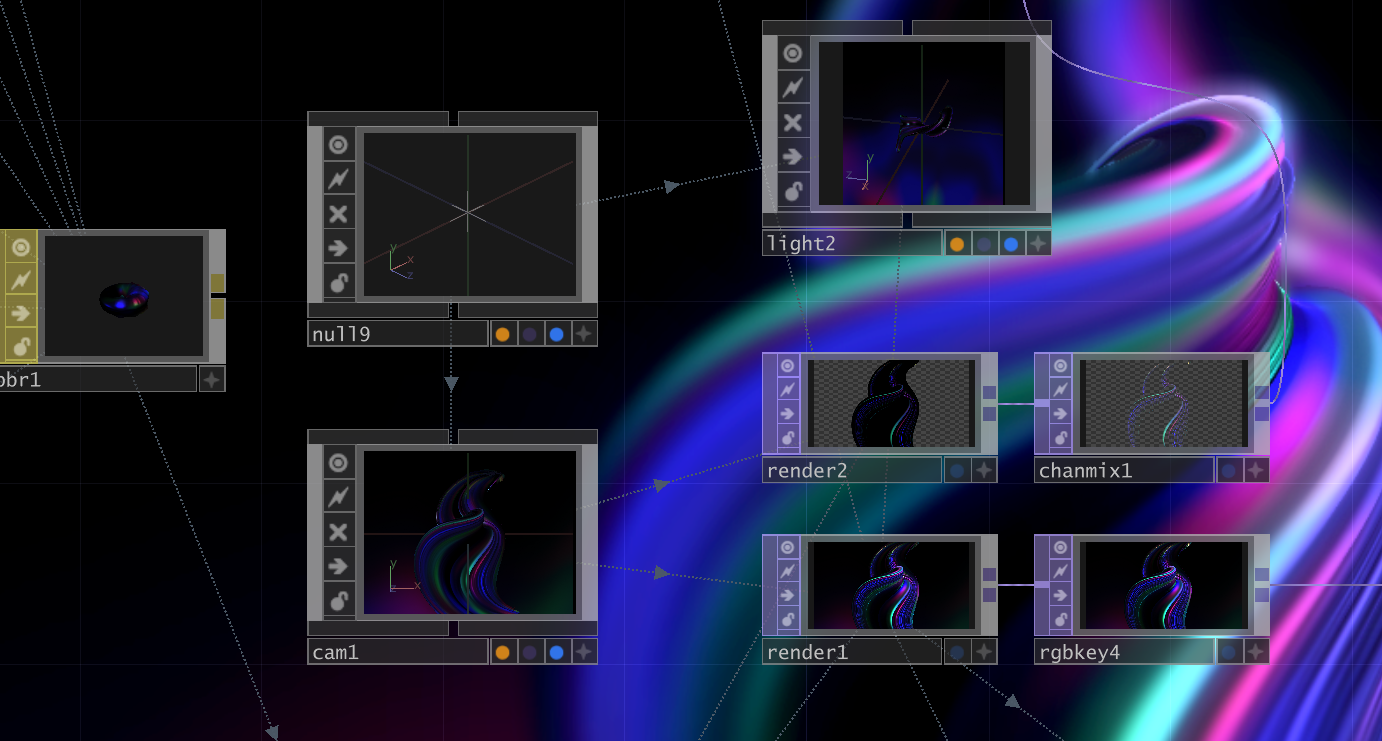
After extensive evaluation, I selected TouchDesigner for its robust Point Cloud features and real-time audio reactivity. TouchDesigner's node-based workflow allows for rapid prototyping while its GPU-accelerated rendering maintains performance even with thousands of particles.
The point cloud system maps audio frequencies to spatial positions, creating three-dimensional sound sculptures that respond in real-time. Different frequency bands control particle density, movement speed, and visual properties, creating an intuitive correlation between sound and form.
Exploring Audio Visualization Techniques
With the conceptual direction established in Week 3, I immediately began experimenting with different approaches to audio visualization. This week marked the transition from theory to practice, as I explored various techniques for translating sound into visual form. Each experiment taught me something crucial about the relationship between audio data and visual representation.
The goal wasn't to create polished artworks yet, but to understand the fundamental principles: How does audio analysis work? What visual parameters can be controlled? Which approaches feel intuitive versus arbitrary? Through rapid prototyping and iteration, I began to discover the aesthetic language that would define the project.
Development Progress
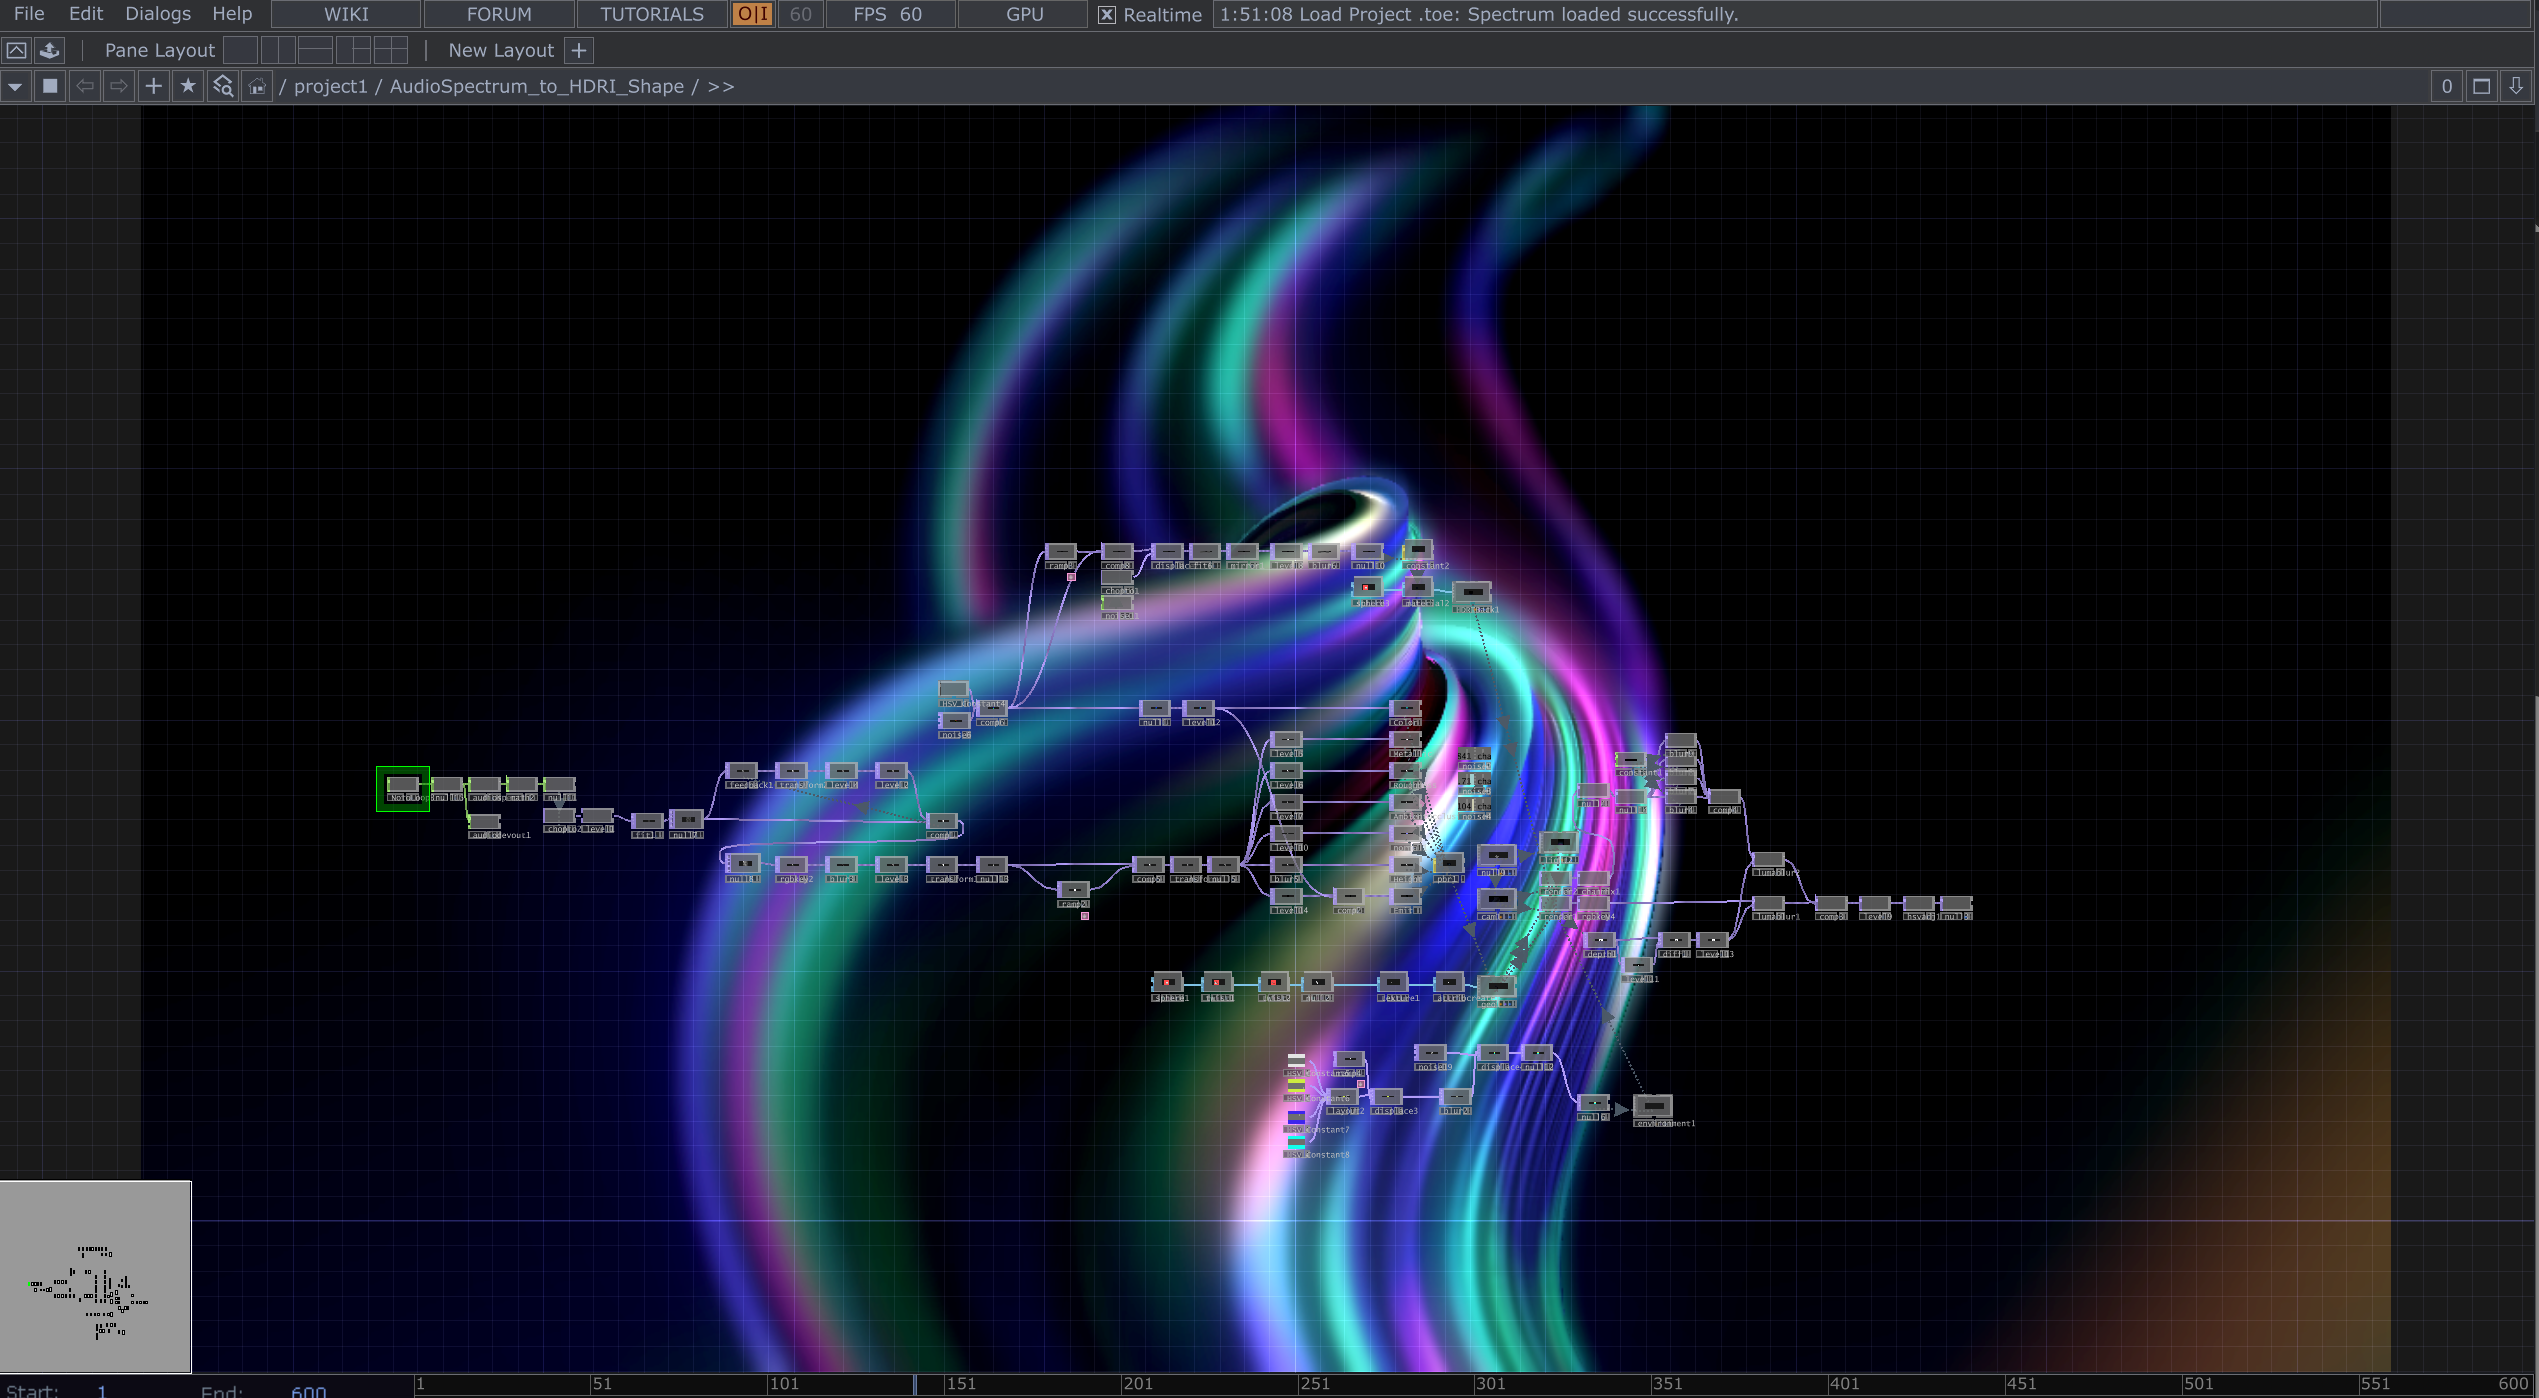
The development process involved building a complex node network in TouchDesigner, progressively adding audio analysis capabilities, visualization parameters, and real-time controls. Below are key stages in the technical implementation.
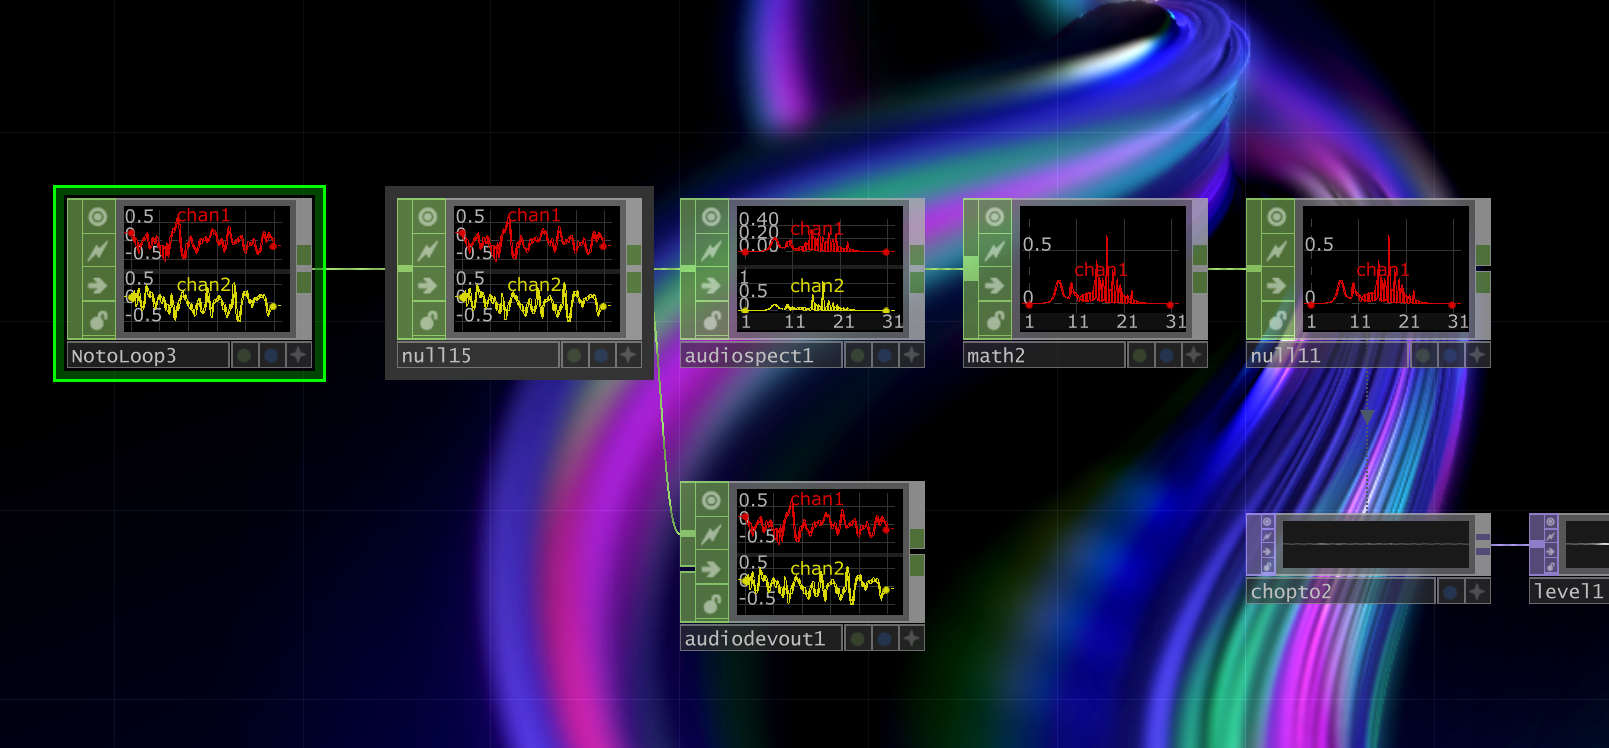
Initial node setup: Building the audio analysis system
Developing the visualization pipeline
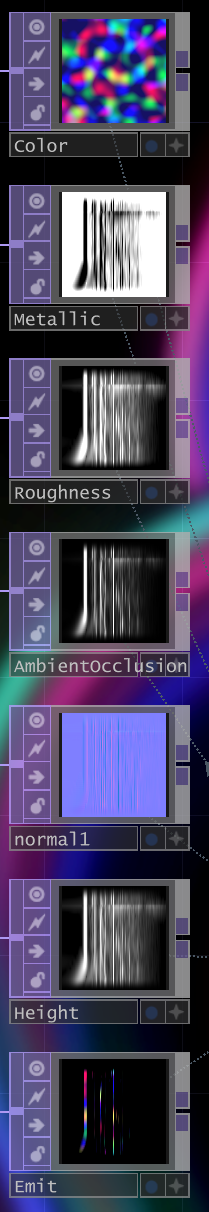
Refining parameter controls and mappings
Final node network showing complete system
Key Breakthrough: Audio Reactive Spectrum Line
Among all the experiments this week, the Audio Reactive Spectrum Line emerged as the most promising approach. This visualization technique became a turning point in the project, revealing how audio frequency data could be transformed into elegant, flowing linear forms that feel both scientific and poetic.
The concept is deceptively simple yet visually powerful: each frequency band of the audio spectrum is mapped to a vertical position, creating a continuous line that rises and falls with the sound. What makes this approach special is how it preserves the temporal flow of musicyou can literally see the rhythm, melody, and harmony as they unfold in real-time. The line doesn't just react to sound; it becomes a visual score, a living waveform that dances with the audio.
Unlike traditional spectrum analyzers that use rigid bar graphs, this fluid line approach creates organic, wave-like movements. The smoothness of the curves, combined with the real-time responsiveness, gives the visualization an almost organic qualityas if the sound itself is breathing and moving through space. This became the foundation for understanding how noise could be "sculpted" into aesthetic form.
Audio Reactive Spectrum Line 1: A continuous line visualization where each point represents a frequency band in the audio spectrum. The vertical position corresponds to amplitude, creating a flowing, wave-like form that responds in real-time to sound. This approach revealed how audio data could be transformed into elegant, organic visual shapesa key insight that would guide all future prototyping.
Supporting Experiments
Beyond the spectrum line breakthrough, I explored several other visualization approaches to understand the full range of possibilities. Each experiment focused on a different aspect of audio-visual translation, testing various parameters and techniques.
Audio Analyze: A technical exploration of audio analysis methods, breaking down sound into its component frequencies and amplitude envelopes. This experiment focused on understanding the raw data structurehow audio signals are decomposed into analyzable parameters.
Audio Shape: An experiment in translating audio into geometric forms. Rather than flowing lines, this approach uses audio data to modulate the shape of geometric primitivescreating pulsing, morphing forms that respond to different frequency bands.
Audio Noise (Version 1): A more chaotic, particle-based approach where audio drives turbulence and randomness in the visual system. This experiment explored whether noise itselfboth sonic and visualcould be a creative material.
Audio Noise 2: A refined iteration of the noise concept, with more controlled parameters and smoother transitions. This version introduced layering, with different frequency bands controlling different particle layers, creating depth and spatial separation.
What I Learned
These experiments revealed several crucial insights that would shape the project's direction:
- Continuity vs. Discreteness: Flowing, continuous forms (like the spectrum line) feel more musical and organic than discrete elements (like bars or shapes)
- Readability: The best visualizations maintain a balance between complexity and claritytoo simple feels boring, too chaotic becomes noise
- Temporal Flow: Audio is inherently time-based, so effective visualizations must preserve the sense of temporal progression and rhythm
- Multiple Layers: Separating different frequency bands into distinct visual layers creates depth and allows the viewer to "see" the composition of sound
- Aesthetic Intention: Pure data visualization isn't enoughthe visuals must have aesthetic coherence and intentional design choices
The Audio Reactive Spectrum Line became the foundation for future development because it embodied all these principles while remaining elegant and intuitive. It showed me that noise visualization doesn't have to be complex to be powerfulsometimes simplicity reveals the most profound beauty.
Outcome & Insights
Successfully created the first 'Audio Reactive Point Cloud' prototype, validating the technical approach and demonstrating feasibility for the final installation. The prototype revealed several key insights:
- Point clouds effectively convey sound's spatial qualities and temporal dynamics
- Real-time audio analysis can drive complex particle systems without latency
- TouchDesigner provides the necessary balance of power and flexibility
- The visual language feels intuitiveviewers naturally connect sound to form
This prototype serves as the technical foundation for subsequent iterations, which will add embodied interaction and gestural control.
Next Steps
With technical feasibility validated, the next phase shifts to academic grounding and theoretical framework:
- Draft the Research Proposal Outline (RPO)
- Establish theoretical foundation for perceptual shift
- Contextualize the work within existing sound art and HCI research
- Formulate the core research question